Statistics On 16 Million Claude Users (2025)
Claude AI now has 16 million monthly active users globally, which is way less than ChatGPT or Google Gemini, but most of the users are niche users and growing at a consistent pace. The user base has grown by 300% since the launch of the platform (2003).
In this post, we take a closer look at Claude's 16 million users and learn their demographics and usage patterns.
Claude AI Statistics (Top Picks)
- Claude has 16 million MAUs in 2025.
- 21.6% of Claude users are based in the United States.
- 77% of Claude users are males, while 23% are female.
- Users aged 18 to 24 make up 51.9% of the platform's user base.
Number Of Claude AI Users
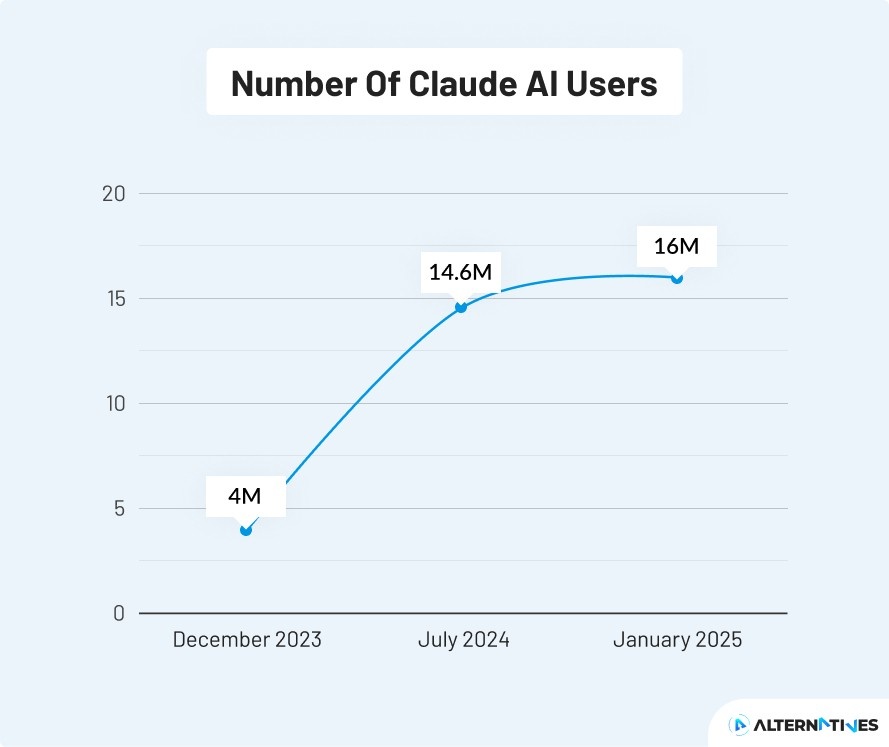
Claude AI has 16 million users as of 2025, which is a 300% increase from 2023, when the platform was launched. The user count peaked in November of 2024 when the platform had 18.8 million users.
In December of 2023, Claude had 4 million users and managed to reach 14.6 million users by mid-2024.
| Time | Claude AI Users |
| December 2023 | 4 million |
| July 2024 | 14.6 million |
| January 2025 | 16 million |
Claude additionally serves millions of people through integrations, for example, more than 40 million riders and over 1 million Lyft drivers use Claude AI indirectly.
WRTN, a leading consumer AI aggregator in South Korea and Japan, utilizes Claude to deliver natural, engaging character interactions and creative storytelling to 4.5 million users.
Claude App Users
As of 2025, there are 2.9 million Claude app users, which puts it at the 36th most popular app in the productivity category on the Apple App Store. The app also has over 50 lakh downloads on the Google Play Store.
Claude Users By Country
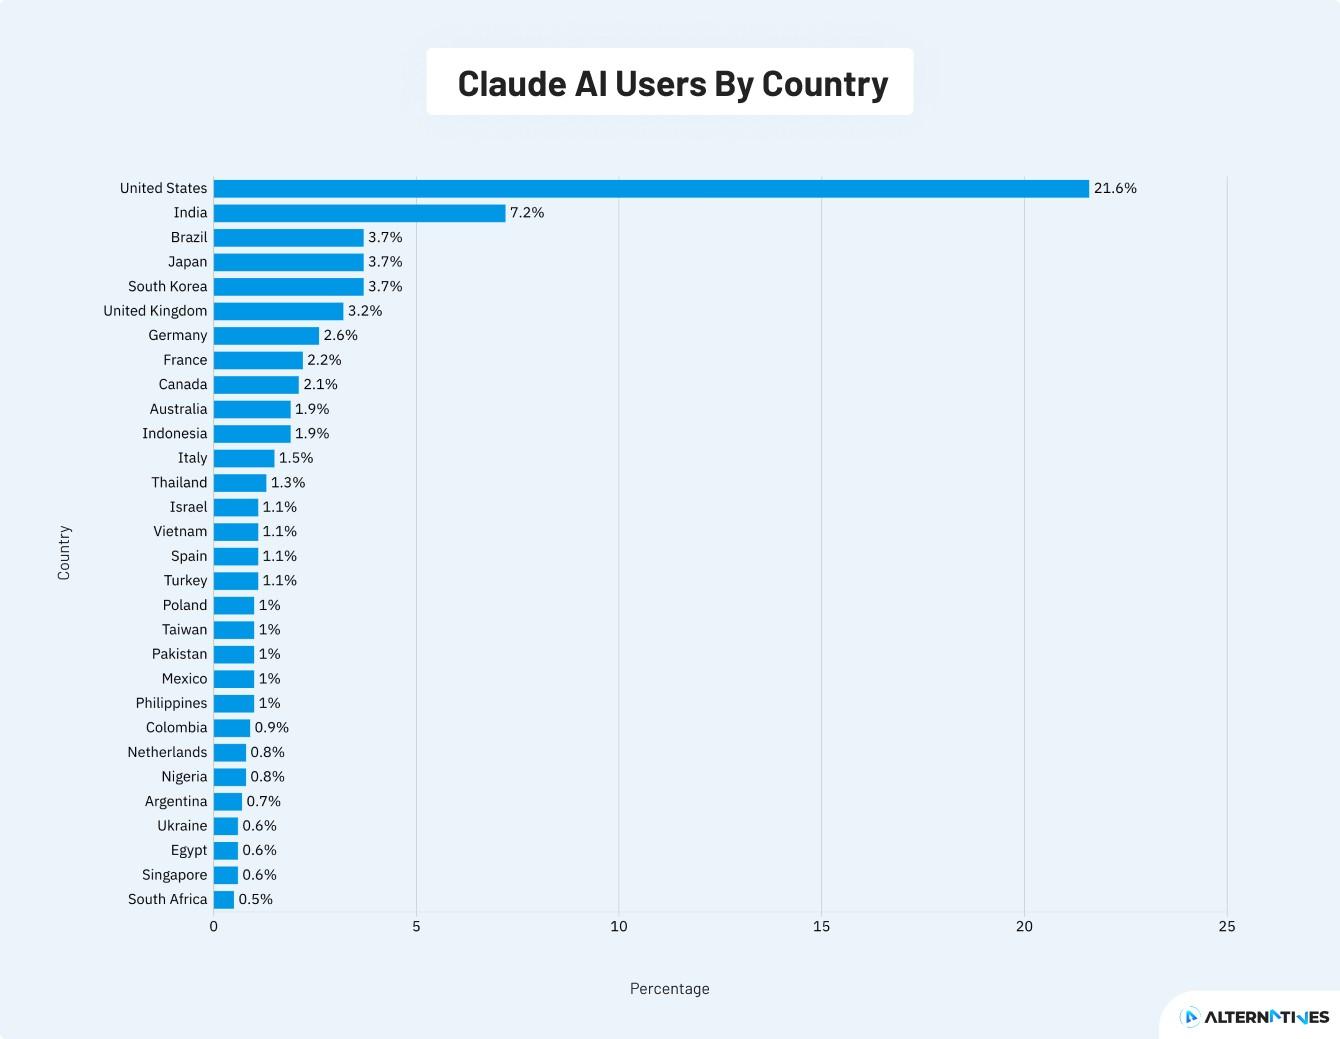
21.6% of Claude's users are from the United States, and 7.2% are from India.
Here is a table showing the share of Claude AI users by country:
| Country | Percentage |
| United States | 21.6% |
| India | 7.2% |
| Brazil | 3.7% |
| Japan | 3.7% |
| South Korea | 3.7% |
| United Kingdom | 3.2% |
| Germany | 2.6% |
| France | 2.2% |
| Canada | 2.1% |
| Australia | 1.9% |
| Indonesia | 1.9% |
| Italy | 1.5% |
| Thailand | 1.3% |
| Israel | 1.1% |
| Vietnam | 1.1% |
| Spain | 1.1% |
| Turkey | 1.1% |
| Poland | 1.0% |
| Taiwan | 1.0% |
| Pakistan | 1.0% |
| Mexico | 1.0% |
| Philippines | 1.0% |
| Colombia | 0.9% |
| Netherlands | 0.8% |
| Nigeria | 0.8% |
| Argentina | 0.7% |
| Ukraine | 0.6% |
| Egypt | 0.6% |
| Singapore | 0.6% |
| South Africa | 0.5% |
Source: Anthropic.
Claude Users By Gender
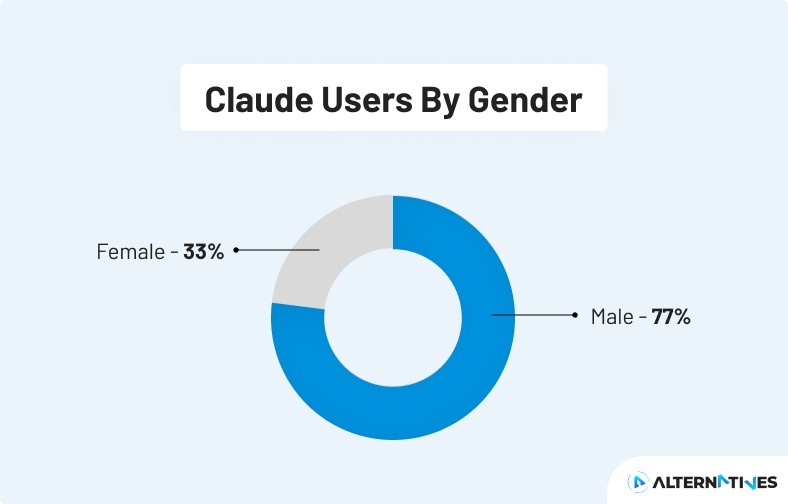
77% of Claude AI users are male, while 23% are female.
| Gender | Share Of Users | Users |
| Male | 77% | 12.3 million |
| Female | 23% | 3.7 million |
Claude Users By Age
Half of Claude AI's user base (51.9%) is aged between 18 to 24 and makes up the most. While people aged 25 to 34 make up the second biggest user base of the platform, with a 25% share.
As we move ahead in the age groups, the share of users decreases, making it very clear that Claude is popular among the younger generations.
Here is a table showing the Claude userbase by age:
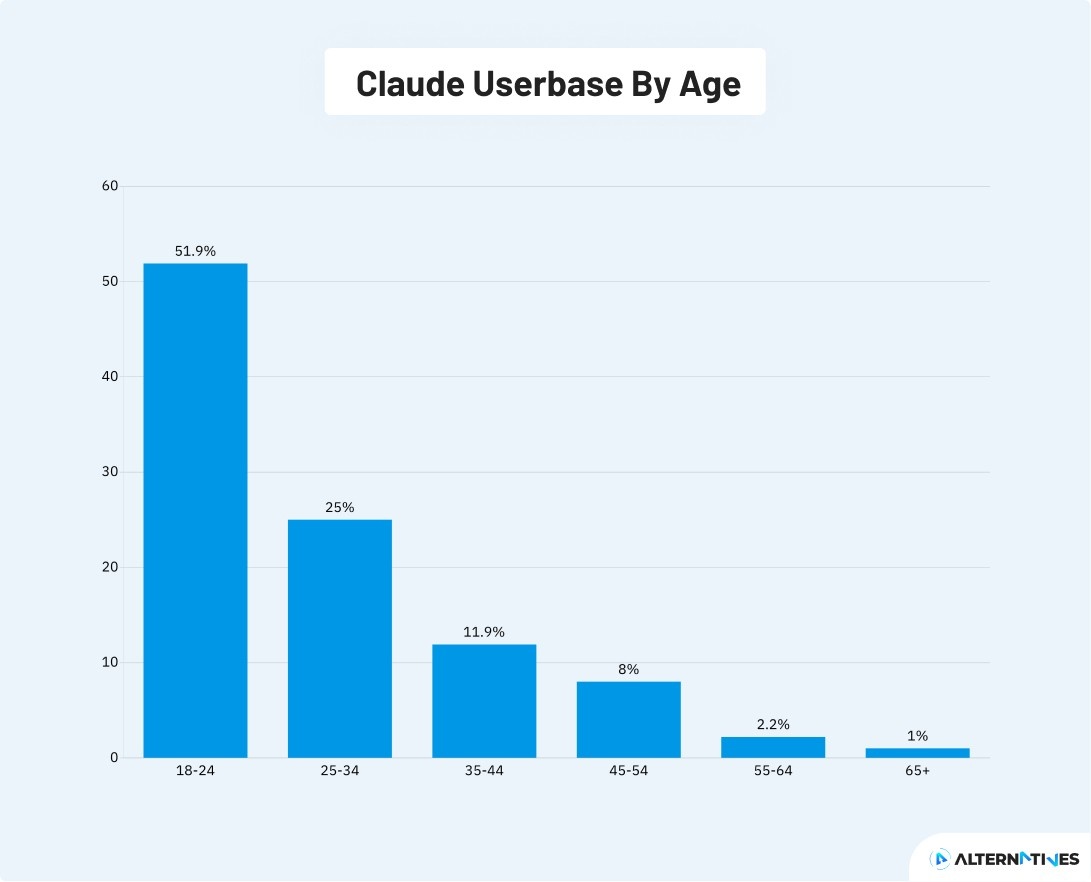
| Age | Share of Total | Users |
| 18-24 | 51.9% | 8.3 million |
| 25-34 | 25% | 4 million |
| 35-44 | 11.9% | 1.9 million |
| 45-54 | 8% | 1.28 million |
| 55-64 | 2.2% | 0.35 million |
| 65+ | 1% | 0.16 million |
Claude AI Usage In The United States
The map shows that AI adoption is strongest along the West Coast and Northeast, where established tech hubs and dense populations drive usage into the top 25%. Large but less tech-concentrated states like Texas, Florida, and Illinois fall into the upper middle tier, showing solid adoption without matching the intensity of the leaders.
Much of the Midwest and South sits in the middle range, reflecting steady but not dominant uptake. In contrast, rural and sparsely populated states in the Mountain West, Deep South, and non-contiguous regions (Alaska, Hawaii) are in the bottom tier, highlighting slower adoption relative to their working-age populations.
Source: Anthropic.
What Users Seek from Claude in Affective Conversations
Affective conversations make up 2.9% of Claude usage. We have data on what people actually want from Claude when they initiate an affective chat.
| Category | Percentage of All Conversations |
| Interpersonal advice | 2.26% |
| Coaching | 1.13% |
| Psychotherapy or counseling | 0.34% |
| Companionship | 0.31% |
| Romantic roleplay | 0.05% |
| Sexual roleplay | 0.02% |
Topics and concerns discussed with Claude range from career development and navigating relationships to managing persistent loneliness and exploring existence, consciousness, and meaning.
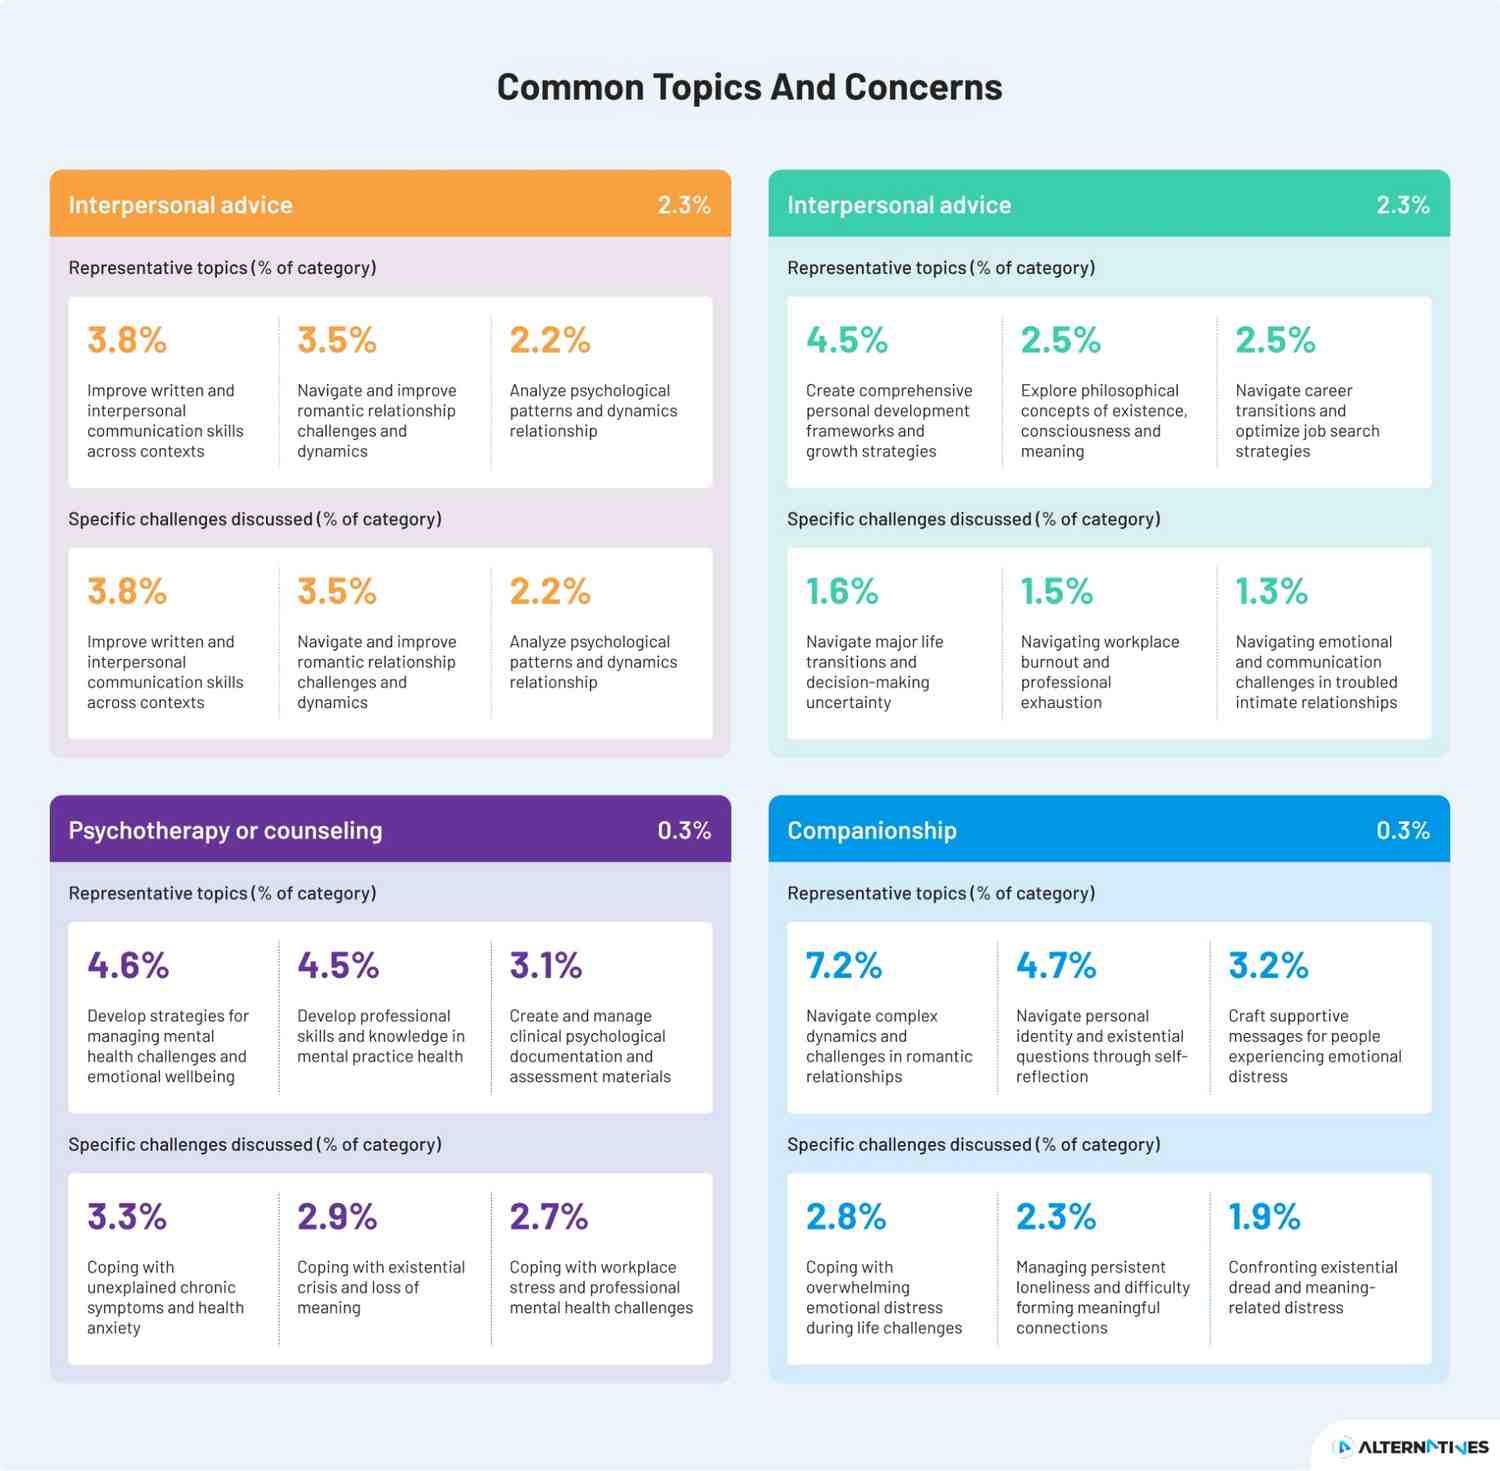
Source: Anthropic.
Claude AI Usage By Fields
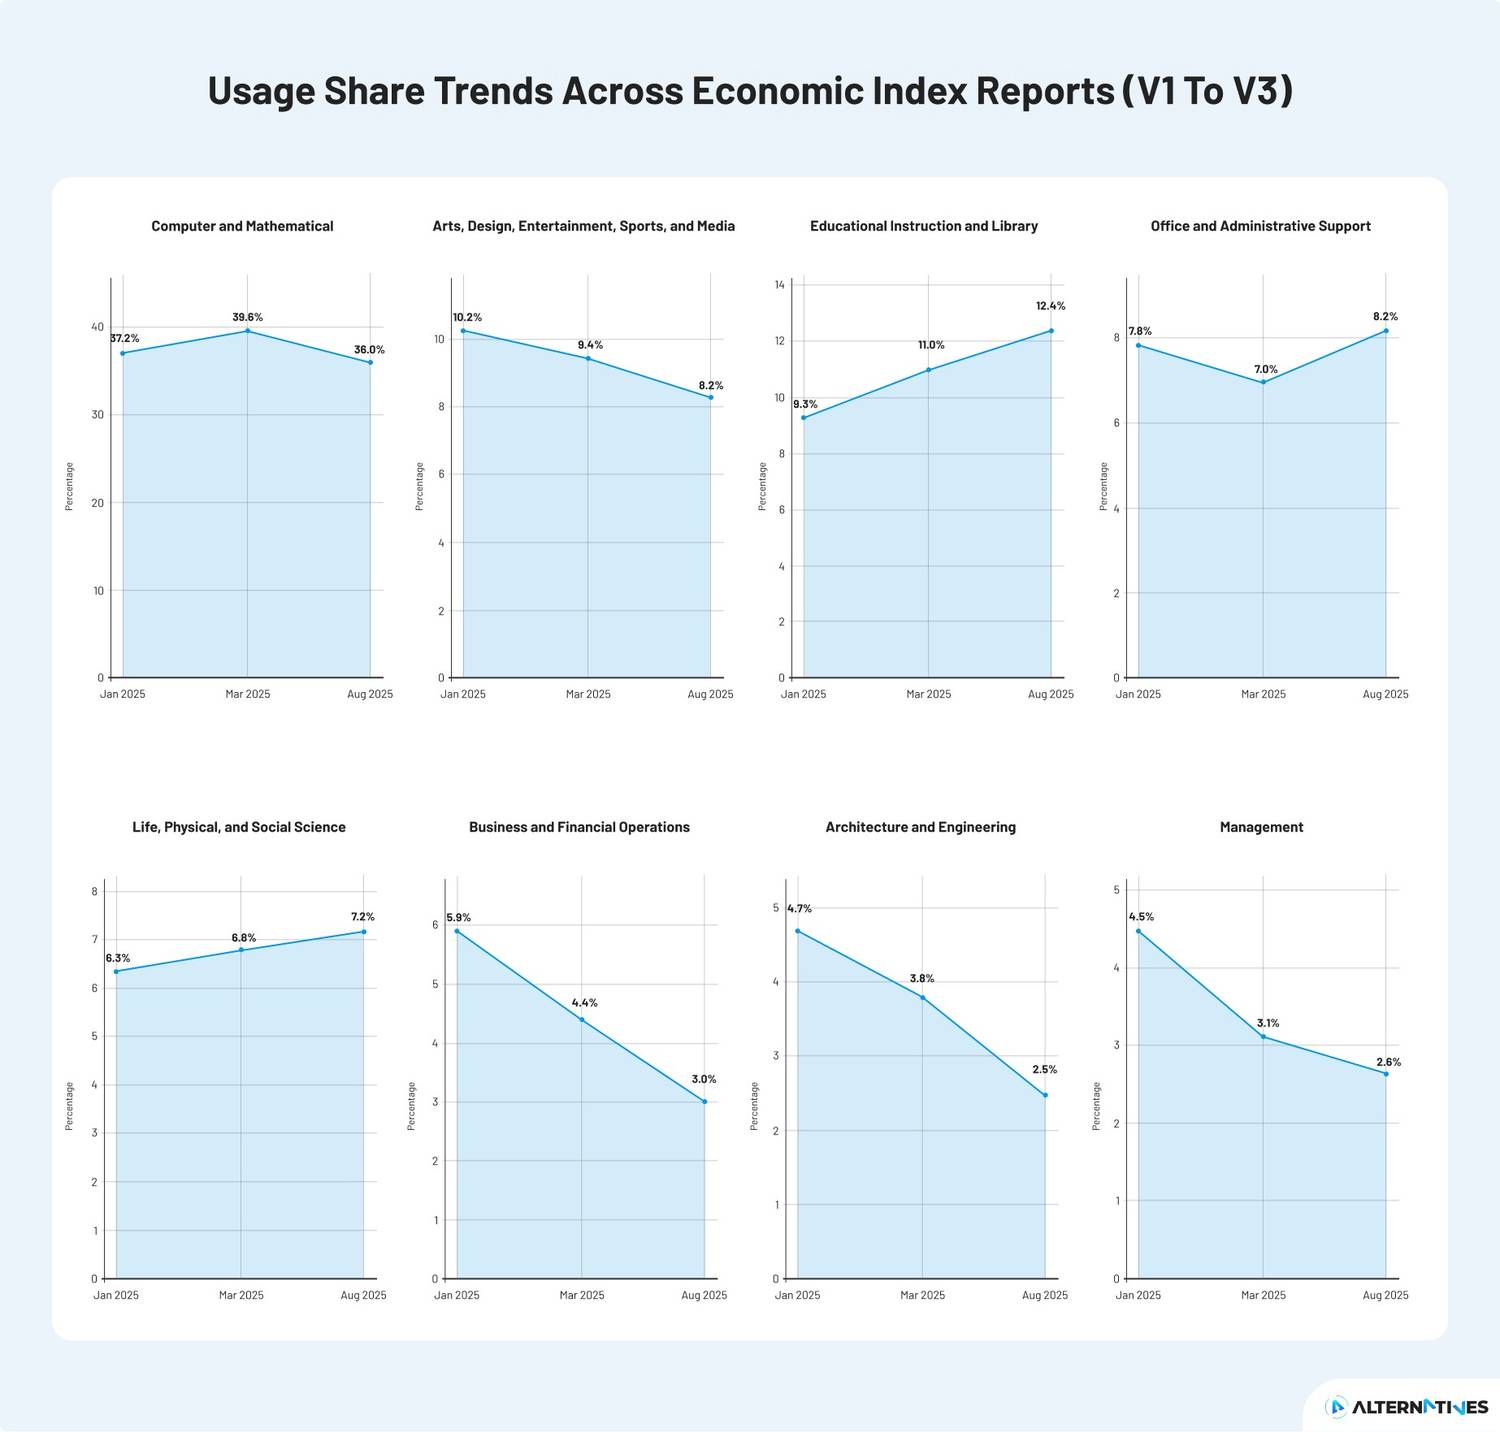
| Tasks | Jan 2025 | Mar 2025 | Aug 2025 |
| Computer and Mathematical | 37.2% | 39.6% | 36.0% |
| Arts, Design, Entertainment, Sports, and Media | 10.2% | 9.4% | 8.2% |
| Educational Instruction and Library | 9.3% | 11.0% | 12.4% |
| Office and Administrative Support | 7.8% | 8.2% | 7.0% |
| Life, Physical, and Social Science | 6.3% | 6.8% | 7.2% |
| Business and Financial Operations | 5.9% | 4.4% | 3.0% |
| Architecture and Engineering | 4.7% | 3.8% | 2.5% |
| Management | 4.5% | 3.1% | 2.6% |
- Claude AI usage in the computer and mathematical tasks shows a slight increase from 37.2% in January to 39.6% in March, followed by a drop to 36.0% by August.
- Arts, Design, Entertainment, Sports, and Media: A declining trend is seen in Claude AI usage from 10.2% in January to 8.2% in August.
- Educational Instruction and Library: Claude AI usage shows a consistent increase, from 9.3% in January to 12.4% in August.
- Office and Administrative Support: While there's a slight decrease, usage increases to 8.2% in March before dropping to 7.0% by August.
- Life, Physical, and Social Science: Claude AI shows modest growth, rising from 6.3% to 7.2%, reflecting steady adoption in this sector.
- Business and Financial Operations: A significant decline in Claude AI usage from 5.9% to 3.0%, indicating a downward trend in its relevance or application in this field.
- Architecture and Engineering: A steady decline from 4.7% to 2.5%, showing a shrinking focus on AI usage in this sector.
- Management: Claude AI usage in management drops from 4.5% in January to 2.6% by August, with a decline seen in both March and August, reflecting a diminishing trend.
Source: Anthropic.
Claude API Usage Statistics
API customers, primarily businesses and developers, use Claude differently from those accessing it through Claude.ai. API customers pay per token instead of a fixed monthly subscription, and they can integrate Claude into their own programs.
In terms of usage patterns, 44% of API traffic is focused on computer or mathematical tasks, compared to 36% on Claude.ai. About 5% of API traffic is specifically related to developing and evaluating AI systems. On the other hand, educational tasks make up just 4% of API usage, while on Claude.ai, this figure is 12%. Similarly, arts and entertainment account for 5% of API traffic, whereas it's 8% on Claude.ai.
API customers are also more likely to use Claude for task automation. 77% of API conversations are focused on automation, with most of them being directive (telling the system what to do). In contrast, only 12% of API conversations are about augmentation (enhancing existing tasks). On Claude.ai, the split is nearly even. This suggests that automation with Claude could lead to significant economic and productivity benefits, as automation has historically driven major economic transitions.
Source: Anthropic.